80. In Figure 1.6, if the opportunity cost of producing cars was zero at all levels of production, the production possibilities curve would be best be represented by a
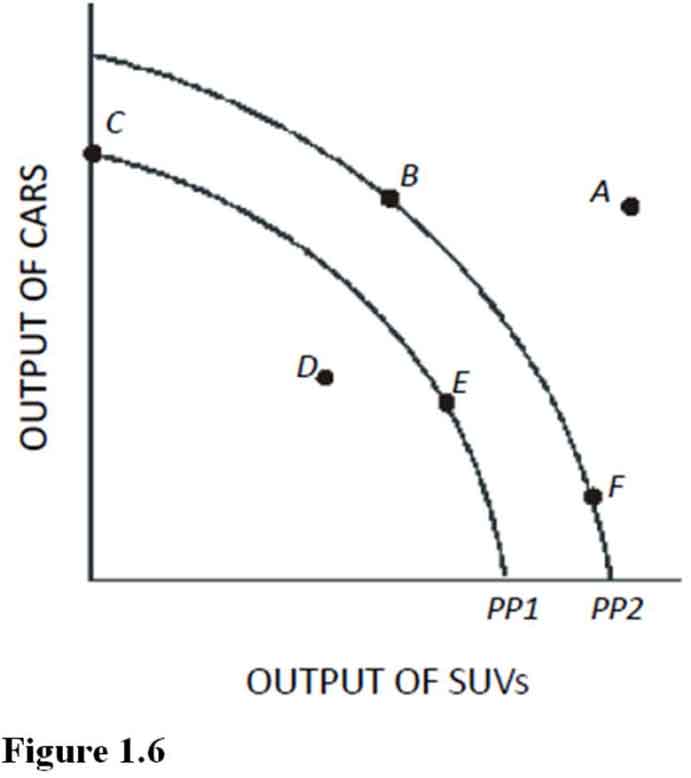
A. Vertical line.
B. 45-degree line starting at the origin.
C. Horizontal line.
D. Circle.